Operationalizing Azure Diagnostic Settings with Azure Policy
- Thomas Lysaa
- Sep 17, 2023
- 3 min read

Updated: 11 hours ago
In Azure, the challenge is rarely whether logging should be enabled. The real challenge is how to enable diagnostic settings consistently, across the right resource types, with the right destinations, and in a way that can actually scale.
That is the problem that Azure Policy approach is meant to solve. To create a repeatable way to generate custom Azure Policy artifacts for Azure resources that support diagnostic logs and metrics, and to use those artifacts to standardize telemetry onboarding across a subscription, management group, or even an entire tenant.
Manually enabling diagnostic settings may work in a small environment, but it does not hold up in a mature Azure estate. As resource counts grow, manual configuration introduces inconsistency almost immediately. Different teams make different decisions, some resources are deployed without the required monitoring, and over time those gaps create blind spots for operations, security, and compliance.
A policy-driven model changes that. Instead of relying on someone to remember to enable diagnostics for every supported resource, you define the desired standard once and apply it through Azure Policy. That makes monitoring part of the platform’s governance model rather than a separate operational task.
In this post we will use Jim Britt's script to accomplish that:
The repository’s own documentation describes the scripts as examples to help create and manage Azure Diagnostic Policies for Azure resources, and specifically explains that Create-AzDiagPolicy.ps1 generates policy artifacts for Azure Diagnostics and can also generate an ARM template for a policy initiative.
From my perspective, that is the real objective: taking diagnostic settings out of the realm of manual administration and turning them into an enforceable governance control.
The documented flow is straightforward: generate policy artifacts, import the custom policies or deploy the initiative, assign them to scope, trigger policy evaluation, and then use remediation to bring existing resources into compliance. The repo also includes companion scripts for triggering evaluation and remediation at subscription or management group scope.
First let's discuss Azure logging basic principles. The diagram shown below illustrates a simplified logging architecture in which Azure event sources emit diagnostic data that can be routed into several destinations. The illustration shows logs being ingested into Log Analytics for searchable, interactive analysis, archived into Azure Storage for native retention, or streamed through Event Hub to third-party platforms. That model is useful because it frames diagnostics not as a single configuration task, but as part of a broader telemetry pipeline.

From a design perspective, Log Analytics is typically the preferred destination when the goal is detection, investigation, and operational troubleshooting. It provides centralized query capability, correlation opportunities, and integration with services such as Microsoft Sentinel. Storage Accounts are better suited for archival and low-cost retention scenarios, particularly when data must be preserved beyond the interactive analysis window. Event Hub, by contrast, is most useful when telemetry needs to be streamed to external SIEMs, data lakes, or custom analytics pipelines. The article also contrasts this with Graph API access, noting that direct API retrieval may be useful in some scenarios but is not a substitute for a scalable logging architecture.
Another important consideration covered in the article is the Azure platform limit on diagnostic settings. Each resource supports a maximum of five diagnostic settings, which means organizations must be deliberate in how destinations are assigned and avoid unnecessary fragmentation. This platform limit becomes especially relevant in complex environments where multiple teams may be sending the same telemetry to different targets.
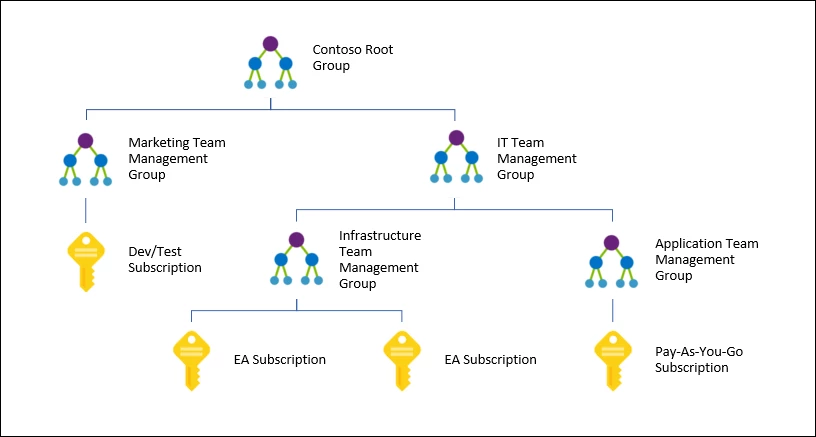
To operationalize diagnostics at scale, Management Groups provide the correct governance layer. As described in the article, Management Groups allow subscriptions to be organized hierarchically and governed from the top down. This makes them an ideal scope for applying consistent monitoring standards across production, development, and other logical environments. Policies can be assigned at this level so diagnostic requirements flow down through the hierarchy instead of being managed independently at each subscription.
This is where Azure Policy becomes the key control mechanism. Rather than relying on administrators to configure diagnostics manually, Azure Policy can be used to define, assign, and enforce diagnostic settings across supported resource types. Here we will use the "Create-AzDiagPolicy.ps1" script to generate custom policy definitions and then deploy those settings through an ARM template. This is a practical pattern for building a repeatable policy-driven deployment model.
Start by running the "Create-AzDiagPolicy.ps1" script to pull all resource types in place:


Now that the custom objects are created we use the ARM template as follows:


Then we can see it in the portal and assign that definition. Now this is a policy initiative meaning it's a group of policies found underneath an initiative.

Then using remediation with a managed identity assignment that applies automation for any future resources (for resource types pulled) to apply the setting. For existing resources just run a remediation job to catch them up to speed.
Comments